Characterization of Mozzi’s filters
(This might become a post in Mozzi’s learn section, eventually)
Mozzi comes with two main audio filters: StateVariable and ResonantFilter.
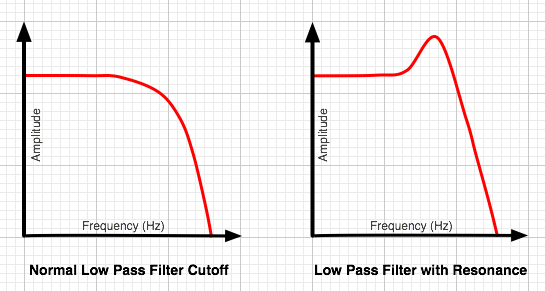
Both of them have two main parameters: cutoff and resonance, the former defining what is the cutoff frequency, hence for a low-pass, where it is going to start attenuating the sound, of the filter and the later defining how “resonant” the filter is. A filter with some resonance will “boost” the frequencies around its cutoff value. The higher the resonance, the bigger the boost but also the narrower the frequency band which is boosted.
Source: https://support.spectrasonics.net
Mozzi’s filters are optimized for speed mainly. As such, the correspondance between the parameters’ values and the real word (in terms of cutoff frequency and gain in dB) are not very well established. This post tries to bring some light on this matter.
Method
The filters are characterized by generating a true white noise in Mozzi using rand(). The sound is created by a RP2040 and outputted via a PT8211 DAC at 32kHz straight into a sound card. Spectra are analysed using Audacity. Gains are measured w/r to the global level outputted without any filter (but with the noise!).
Resonant filter
BandPass
This is the easiest one as the peak frequency is clearly visible when doing the spectrum of the produced sound. Also, as the different filter types available with ResonantFilter are all computed from the same algorithm (different combination of the internal buffer change the filter type), one might expect the results to be the same for the others. Of course, the shape of the response is different but the cutoff frequency and the gain at cutoff should be more or less the same (might be worth checking though).
This is done for the 16bits version of the filter (ResonantFilter<BANDPASS, uint16_t>), results should be similar for the 8bits version, with the parameters in the range [0,255] instead of [0,65535].

Cutoff parameter
By varying the cutoff value and measuring the peak frequency (see image above, left), one can see that the curve $f_{\mathrm{\texttt{resonance}}} = f(\mathrm{\texttt{cutoff}})$ is not really linear, especially on the high end where a small increase in the cutoff value induces a bigger change in the peak frequency. On the broader scale though, things are mostly linear (see inset of the left figure) and definitively not quadratic.
Resonance parameter
Things are a bit less simple here. First, one can see that (left subplot), for the same value of the cutoff parameter, the peak frequency will slightly change with the value of the resonance: for a given cutoff, the peak frequency goes up as the resonance goes down.
The gain at the peak frequency goes dramatically down as the cutoff increases, which is actually mentionned in Mozzi. At very low frequency, the filter can explode for sufficiently high resonance values.
Changing the resonance does affect the gain of the filter around the peak frequency, most notably on the higher end of the resonance parameter (note that the vertical scale being in dB, it is logarithmic). At cutoff=10000 an increase of resonance from 55000 to 65000 incurs a gain of 20dB! This effect gets less and less pronounced at higher frequency, with all the $\mathrm{gain = f(\texttt{cutoff})$ curves merging together at higher frequencies.
To be continued…